How do you analyze several crypto wallet histories together? A Skill that pieces together multi-hop money chains
Each wallet's transaction history is clear on its own, but put side by side it's hard to see who sent money to whom. This post introduces a Skill that puts several wallet histories into one relationship chart, pieces together multi-hop money chains, and lets you click any line to see the individual transactions.
Three wallets, three transaction histories, three analysis pages.
Each one is clear on its own. Put together, they’re still a fog.
Did wallet A transfer directly to wallet B? After wallet B received the money, did it pass it on to wallet C? Among these addresses, which is upstream, which is a relay, and which is the final exit?
In the past, answering these questions meant switching back and forth between pages: copying addresses, searching for counterparties, checking times, comparing amounts, then keeping the results in your head or drawing a separate chart. With three or four addresses you can just about manage. Once it grows to a dozen or several dozen, missing a link in the chain is no surprise.
Earlier, in 《OKLink下载的虚拟币流水不会分析?一个Skill看清虚拟币钱包的资金图谱》 (an earlier article, in Chinese, on analyzing wallet histories downloaded from OKLink), we introduced how Crypto Flow View analyzes a single wallet: where the money came from, where it went, who the main counterparties are, and when the money moved.
This time, we’ve extended it from one wallet to many. It doesn’t just generate a few more pages; it pieces together the money relationships among a batch of known wallets.
Seeing one wallet clearly doesn’t mean seeing the case clearly
A single-wallet page is best at answering local questions.
Open a wallet and you can see its total inflow and outflow, its main sources of funds, its main destinations, how its transactions are spread over time, and all its direct counterparties. This helps you understand the wallet itself, but you can’t see the full relationships across several separate transaction histories.
For example, wallet B shows up on wallet A’s page, wallet C shows up on wallet B’s page, and wallet C also sent money to wallet D. Each page only shows one segment, and the chain that actually matters, A→B→C→D, is scattered across different files and different pages.
An investigator can of course piece it together by hand. The problem is that this depends heavily on personal memory and is hard to check. When someone else takes over, they often have to look it all up again.
Single-wallet analysis answers “what happened to this address.” Multi-wallet analysis answers “what happened between these known addresses.”
Putting several known wallets into one relationship chart
Now, hand several crypto transaction histories to the Skill together, and it first generates an overall relationship chart.
The chart isn’t limited to the three example addresses. It can be two, three, or a whole batch of wallets you already know about; by default it can include up to 200 subjects. The chart keeps only the investigation subjects you explicitly specified this time, and the transfer relationships between them that can be observed in the transaction histories.
Why not put every counterparty in? Because it would quickly turn into a tangle of lines. A wallet may have dozens or even more ordinary counterparties. Put them all into the overall chart, and the subject relationships you actually need to focus on get buried.
So the overall page does something more restrained first: it only answers how the subjects in this investigation are connected. Which ordinary addresses a given wallet has dealt with is something you look at on that wallet’s own page.
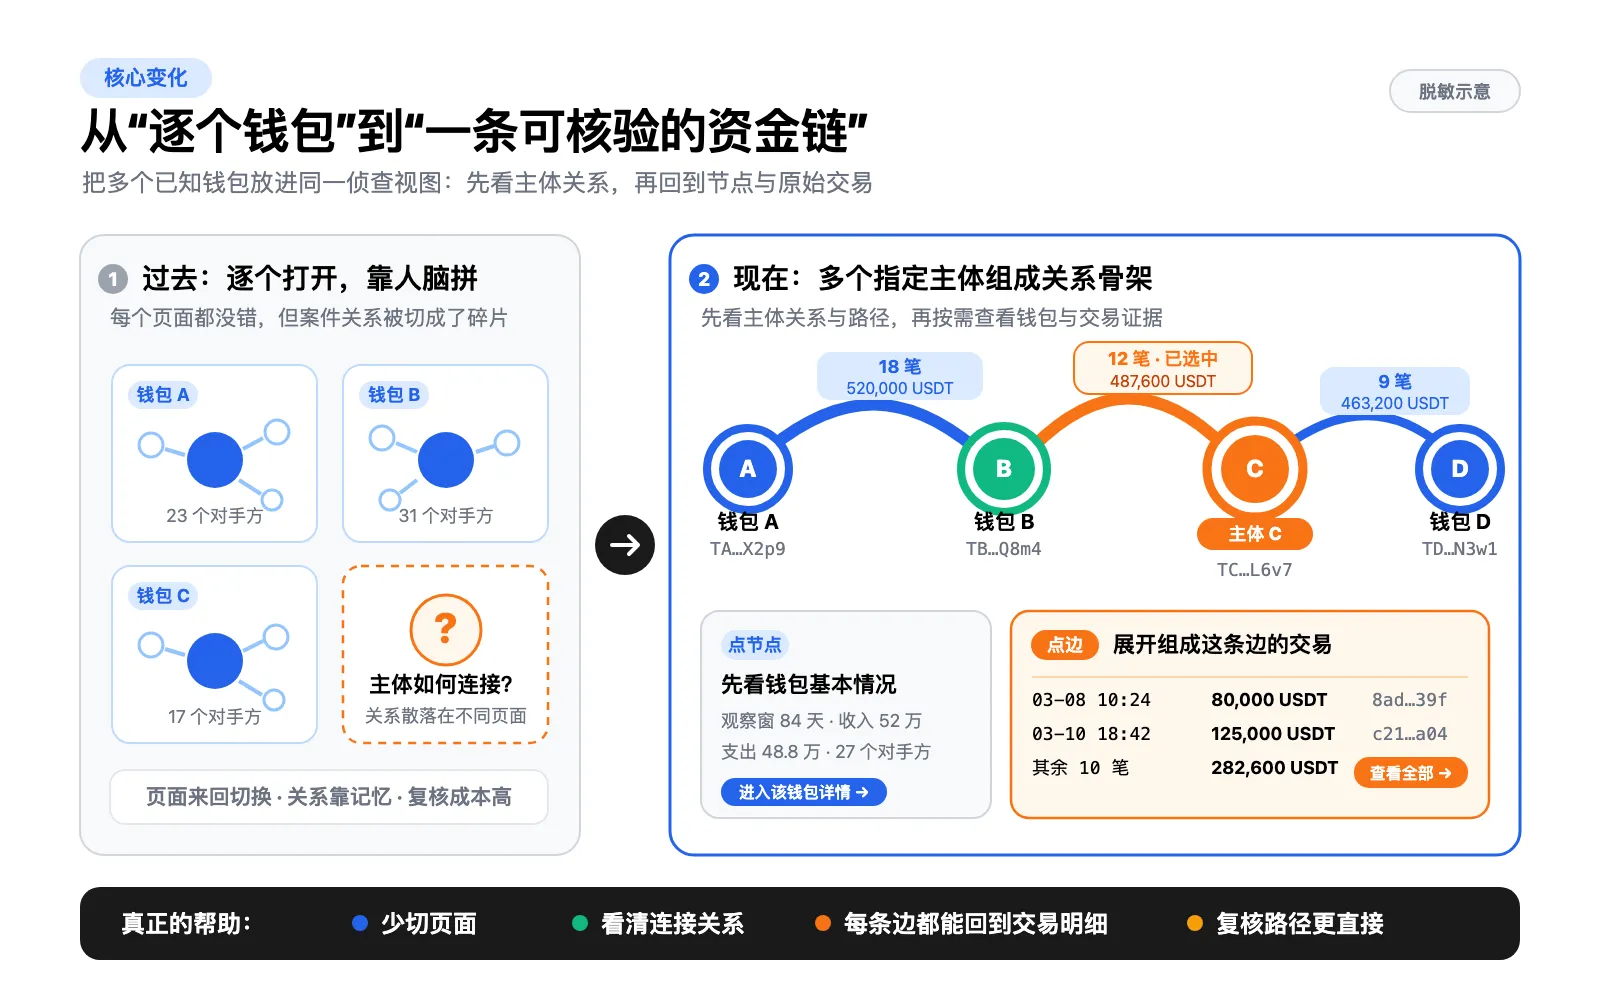
The addresses, amounts and transaction counts in the figure are anonymized illustrations and don’t correspond to real wallets or cases.
The change this figure shows is simple. On the left is the old way: each wallet viewed on its own, with the relationships pieced together in someone’s head. On the right is the new way: A, B, C and D first form a complete skeleton of subject relationships, and you can see at a glance which edge carries the most money and which wallet connects upstream and downstream.
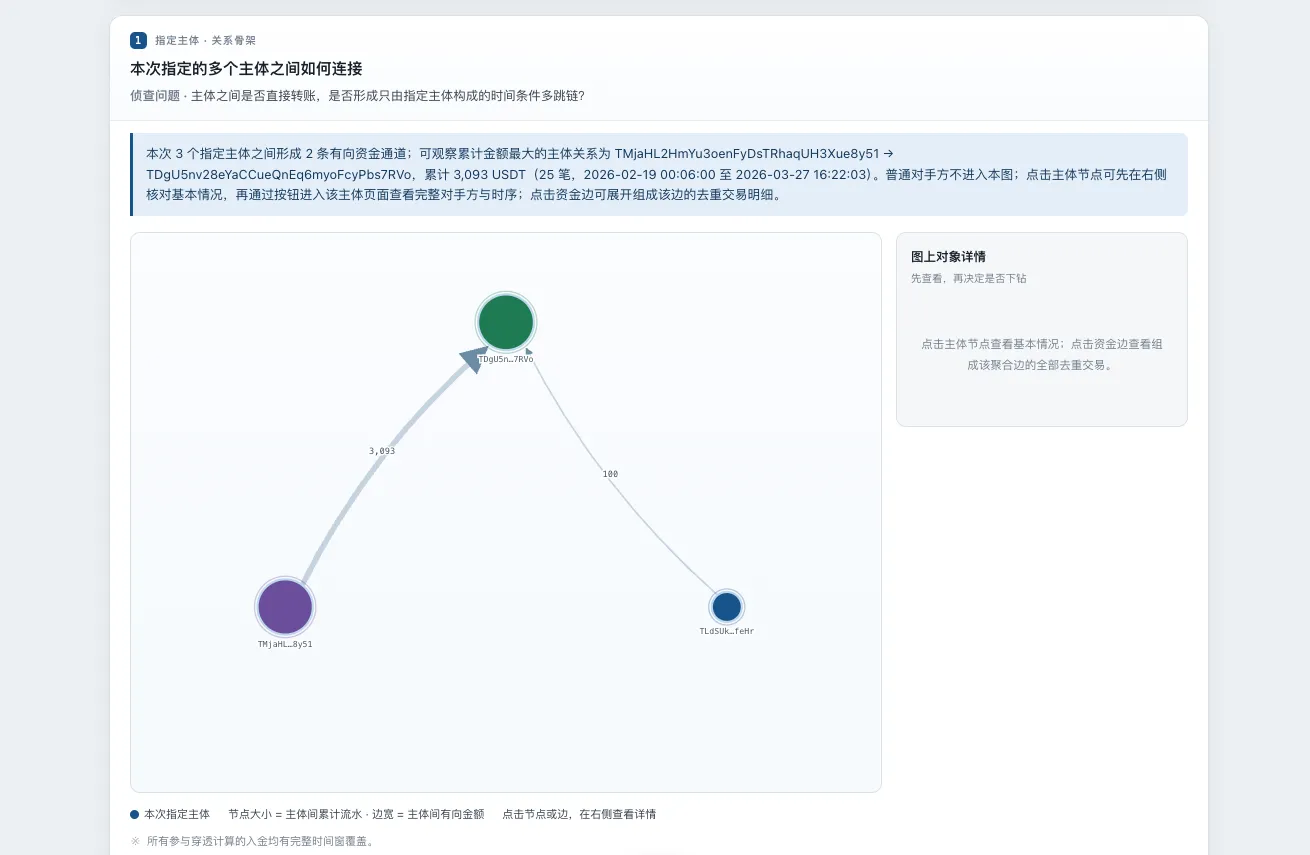
The multi-subject overall page as actually generated: the chart keeps only the three subjects specified this time and the two observable money channels between them.
The tool lays out the relationships; it doesn’t decide what matters
The multi-wallet overall chart can show observable chains like A→B→C→D, and also where each address sits relative to the others in the current chain. But “sitting in the middle” is only a relationship fact on the chart. It doesn’t mean the wallet is more important in the case, and it certainly doesn’t mean the system has identified some fixed role.
The same chain can call for completely different focus under different investigation goals. When tracing where money came from, upstream addresses matter more; when verifying where it went, the downstream exits matter more; when verifying a particular transaction, the focus may be just one specific edge. The case hypothesis, the identities of addresses, other evidence and data that isn’t covered can all change an investigator’s judgment.
So the page doesn’t automatically assign fixed roles to subjects, and it doesn’t rank what the investigator should check first. What it provides is the subject relationships, direction, amounts, times, original transactions and data coverage. The user decides, based on the case, which node to look at and which edge to check.
The tool cuts the cost of piecing relationships together by hand; it doesn’t take over investigative judgment.
Every edge on the chart leads back to individual transactions
An A→B edge on the relationship chart is usually not one transaction but several transfers during the observation period combined. Showing only a thick line and a total amount is intuitive, but it isn’t enough for checking.
So when you click the edge, the right side expands to show every transaction that makes it up, including the time, amount, transaction hash and source file. You can see exactly which transactions make up the relationship, and check whether the amounts match against the original records.
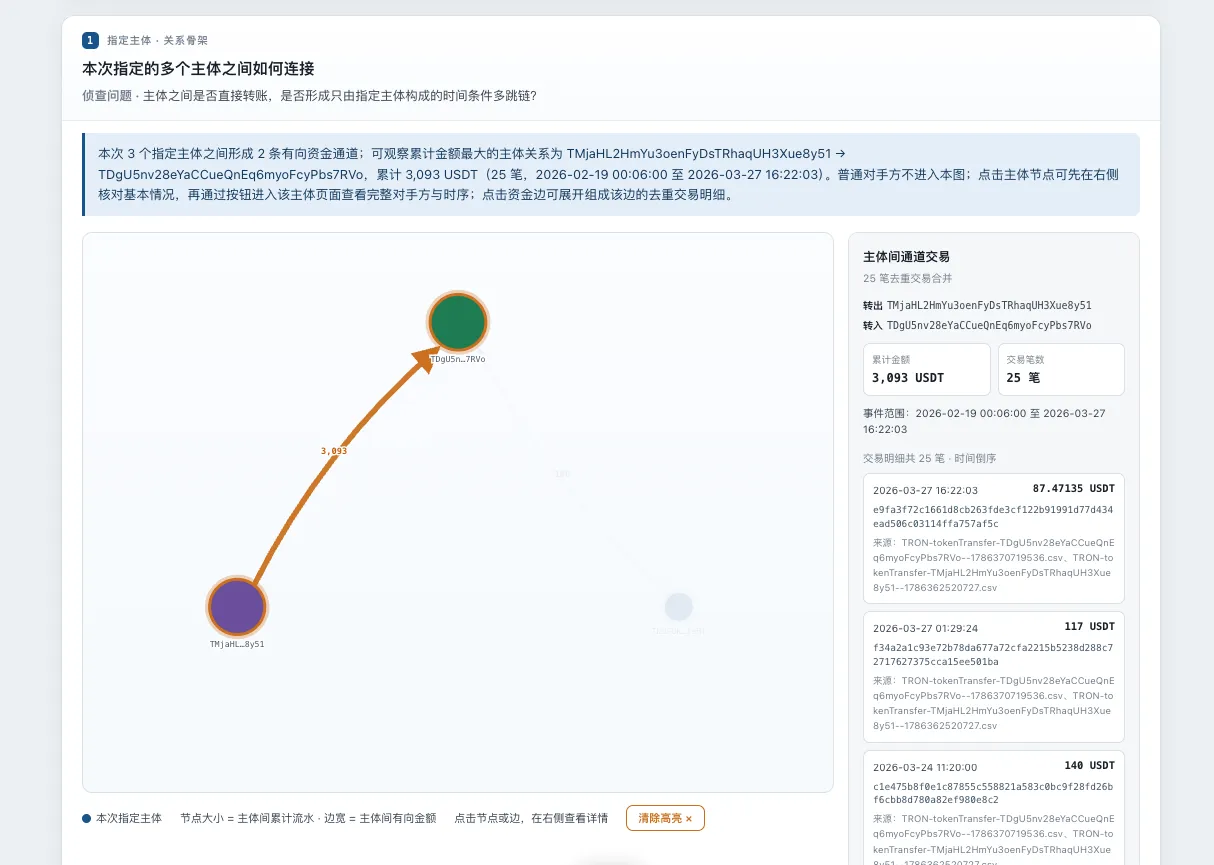
After clicking an aggregated edge, the right side expands to show the total amount, the number of transactions, the time range and each individual transaction.
This edge isn’t an unexplainable system judgment; it’s a set of transaction facts you can check one by one.
Nodes work the same way. When you click a wallet, the page doesn’t jump away immediately. It first shows the wallet’s basics on the right: the observation period, total received and sent, number of transactions, number of counterparties and so on. Once you’ve confirmed it’s worth digging into, you click a button to go to that wallet’s own page.
This way your view of the whole money chain isn’t interrupted, and the way to drill down is still there.
The overall page for the chain, the single-wallet page for the details
Multi-wallet analysis isn’t about replacing every page with one bigger chart. A better approach is to let the two kinds of page answer different questions.
The overall page covers the direct relationships, multi-hop chains, relative positions and main money channels among the specified subjects. The single-wallet page covers all of the address’s direct counterparties, its full money picture and its transaction timeline.
The four-panel figure below shows the “single wallet for details” side. On a wallet’s own page, you can go on to look at four kinds of information: where money came in and where it went; who the direct counterparties are; when transactions happened and whether the account kept any money; and which structural clues need to be checked against the full counterparty table and the original transactions.
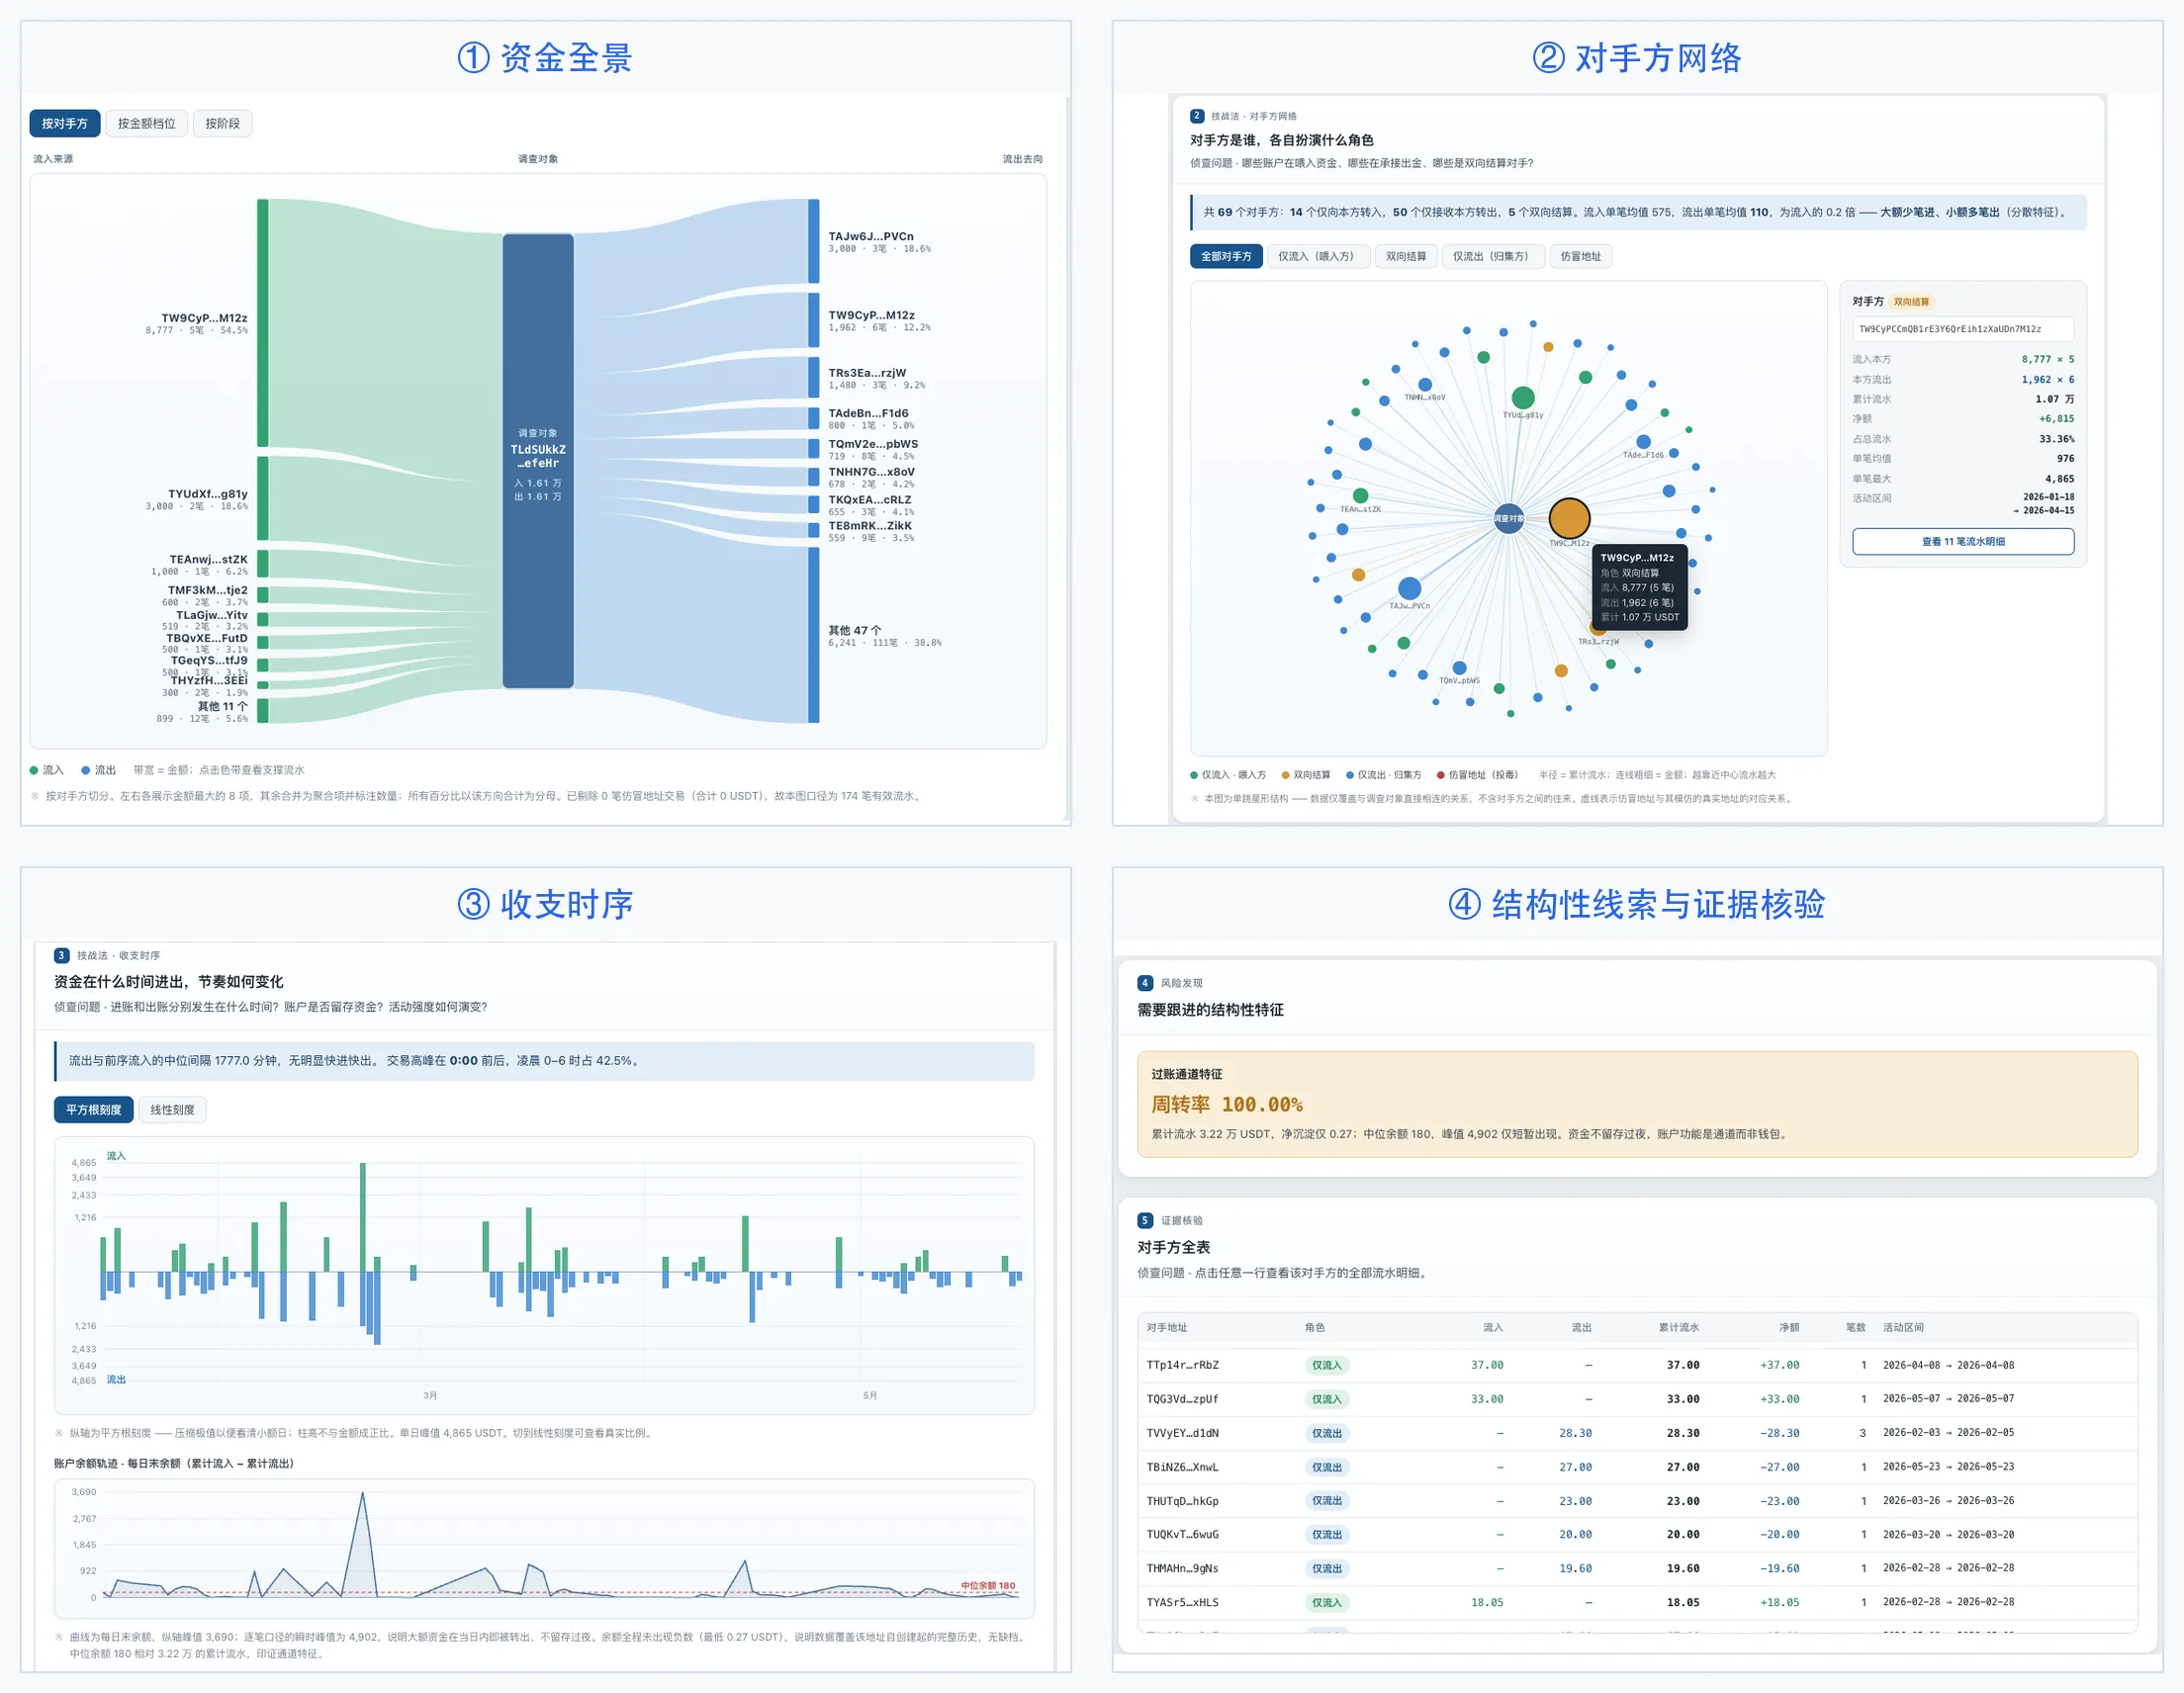
The single-wallet investigation view: details within the current data range, from four angles — the full money picture, the counterparty network, the inflow/outflow timeline and structural clues. Click the image to enlarge it.
In an investigation, you can first use the overall page to judge which subjects are really connected, then click key nodes to go to their single-wallet pages and see their full dealings with ordinary counterparties. If you find a new important address, you can add its transaction history and bring it into the next round of overall analysis.
This makes for a natural investigation process: start from the known subjects, find the key paths, pick the nodes worth digging into, then use the newly obtained data to keep extending the network you can observe.
The time ranges of the different transaction files are also compared together on the overall page. This is to remind users that seeing no transactions in some period may just mean that file didn’t cover it, not that no transactions happened in reality. The single-wallet page keeps only the current wallet’s own observation range and doesn’t repeat the comparison with other addresses’ time ranges.
How to use this Skill
The Skill itself isn’t a piece of software you need to learn separately. Once you have the wallet transaction histories ready, install it into an AI agent that can read files and run tools, then tell the agent which wallets to analyze. Codex, Claude Code and similar agents can all serve as the entry point.
After you get the Skill files, unzip them first and make sure the directory contains crypto-flow-view/SKILL.md. Using macOS or Linux as an example, run the commands for the agent you use from the unzipped directory:
# Install into Codex
mkdir -p ~/.agents/skills
cp -R crypto-flow-view ~/.agents/skills/

# Install into Claude Code
mkdir -p ~/.claude/skills
cp -R crypto-flow-view ~/.claude/skills/
Run just one of the two sets of commands. After installing, reopen the agent or start a new session so it rediscovers the Skill.
If the data is already anonymized, or your organization already has a compliant large language model service: you can plug this Skill straight into your existing agent environment and hand the agent the CSV and Excel files together with the wallet addresses to analyze. For an online model, DeepSeek V4 Flash is a good first choice.
If the data must stay completely offline: the model service, the agent runtime and the file processing all need to run locally or on your internal network. For an offline model, Qwen3.6-27B is a good first choice; then pick an agent environment that can connect to a local model endpoint, read local files and run the Skill, so that the transaction data and the analysis are never sent to an outside service.
Example instruction: “Please use Crypto Flow View to analyze these wallet transaction histories. Treat the following addresses as investigation subjects and generate a multi-subject overall relationship page and a detail page for each wallet.”
Then attach the transaction files and wallet addresses. There can be two, three or more subjects, and you don’t need to merge the files or piece together the address relationships by hand beforehand.
If you’d like to actually use the Crypto Flow View Skill described in this post, feel free to get in touch. You’re also welcome to bring the questions you’ve run into in real analysis work.